Chapter 9 Conditional Death
How does the death (simulation) work?
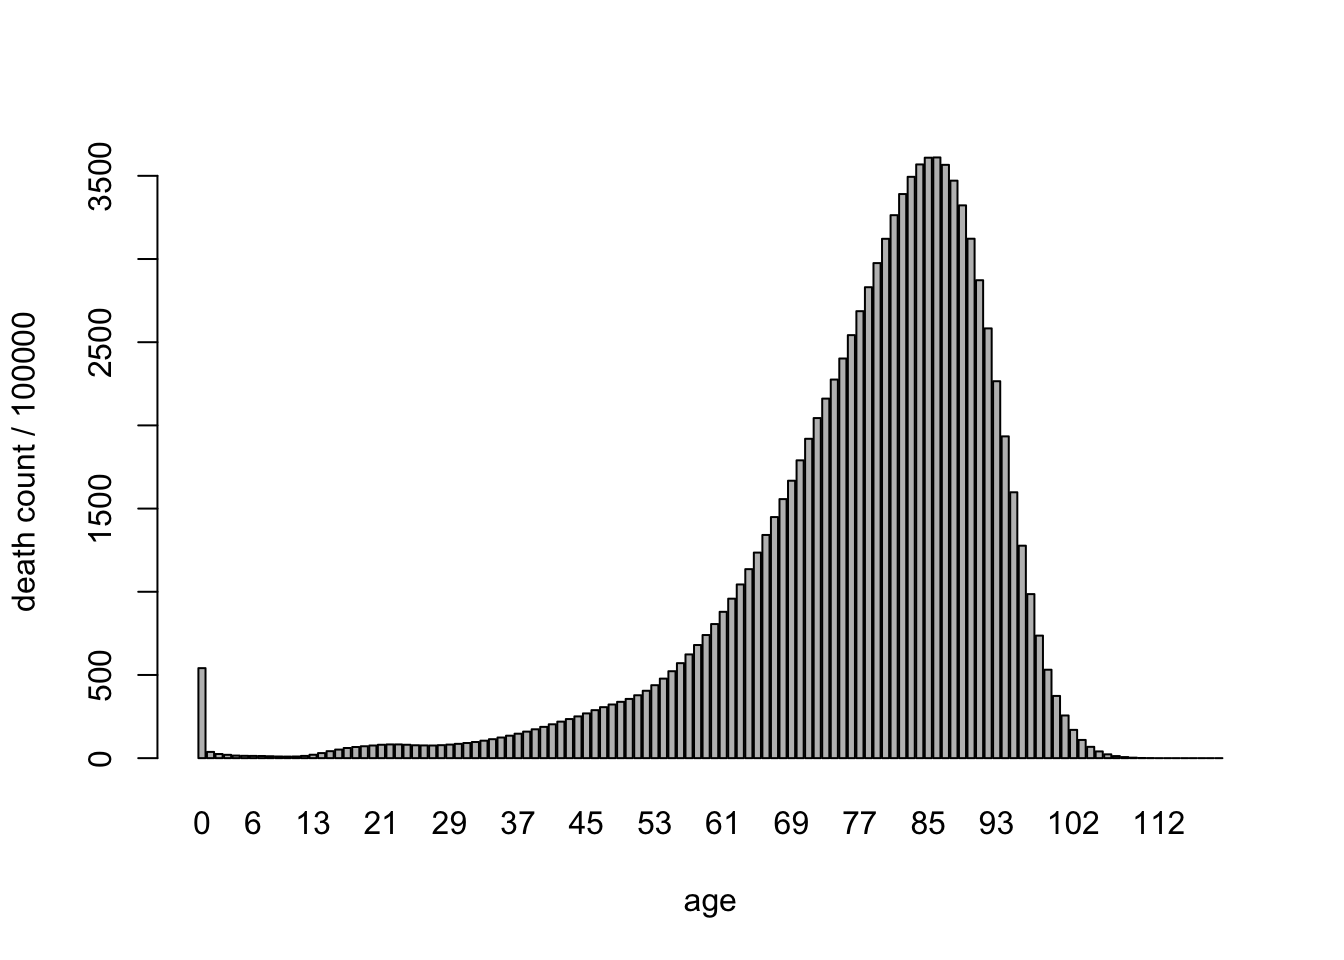
The Flowing Data animated visualization is based on data collected in “life tables”, which can be found online from sources like the National Center for Health Statistics (NCHS) and the Social Security Administration (SSA). Different life tables are produced every year, as life expectancy continues to evolve along with changes in health science and nutrition. Figure 9.1 plots data for age-at-death (for Americans) as of 2010. There is a bar for each age from 0 to 120, and the height of each bar represents a count of deaths at that age per 100,000 people.

Figure 9.1: How long Americans were living in 2010
If you’re like me, the first thing you notice in Figure 9.1 is that little spike at age 0, like a rattle sticking up at the end of a rattle snake’s tail. It shows us that roughly 5 out of 1000 babies don’t make it to their first birthday. After that, your odds get considerably better for a while.
Another feature that you may detect is that the distribution of age-at-death is not symmetric. It has a long tail to the left. Distributions like this are also called left-skewed.
So how does age-at-death relate exactly to the years you have left to live? Life tables are a bit of a strange thing. First of all, they are not tables of “raw data” for a sample of 100,000 people. Rather, they represent a summary of data from many more deaths. According to the SSA source, “the life table represents a hypothetical cohort of 100,000 persons born at the same instant who experience the rate of mortality represented by qx, the probability that a person age x will die within one year, for each age x throughout their lives.”
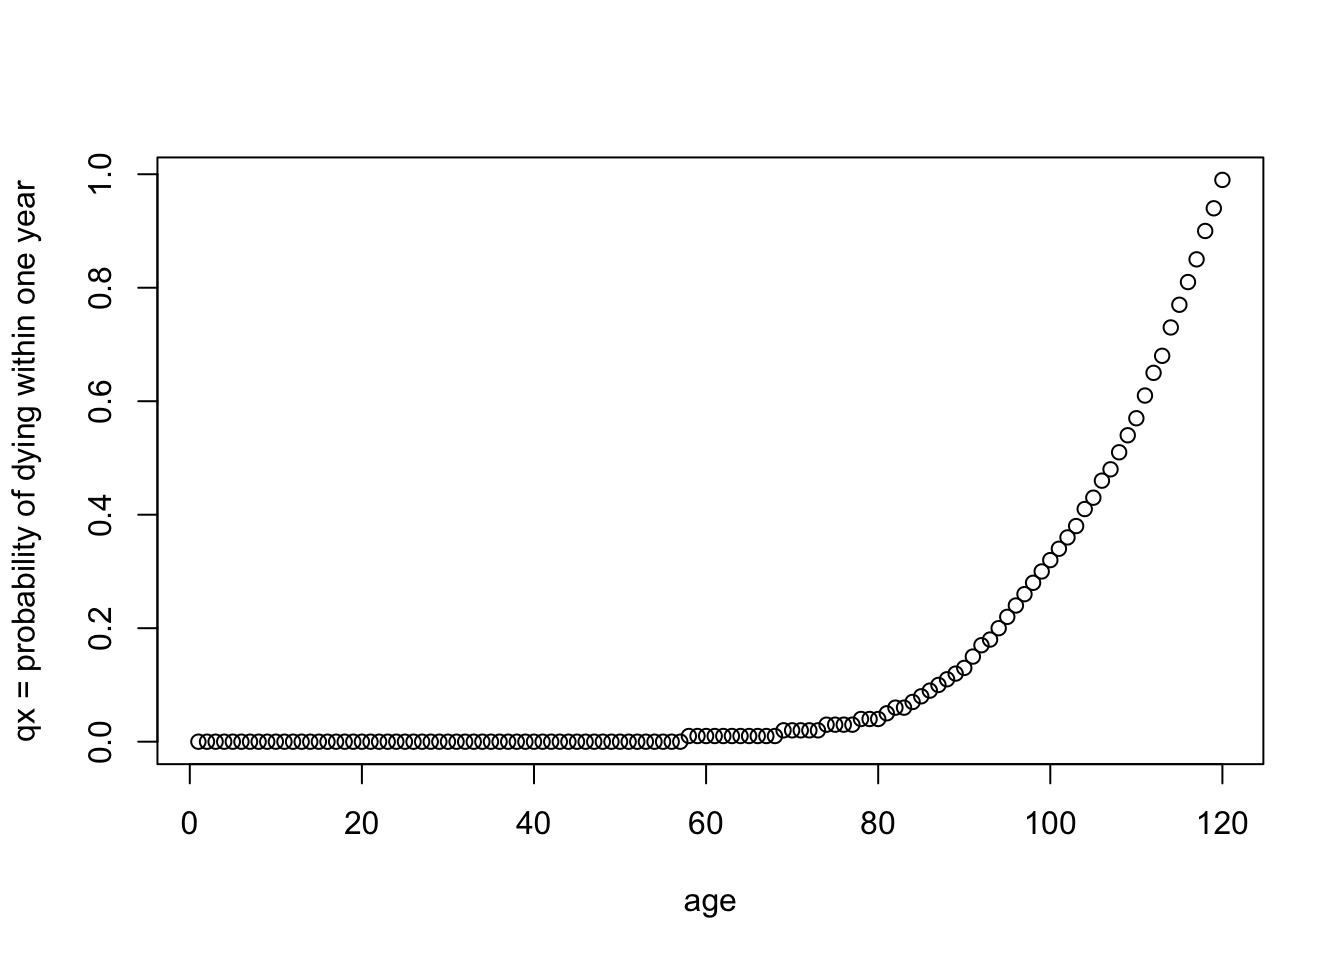
Most of us don’t think about our lives in terms of questions like, are we going to die this year? But that is technically how the life table works. The life table is a set of numbers—including deaths-at-age-x and expected-years-left-to-live-at-age-x—that are all derived from one initial set of numbers which represent the probability that a person age x will die within one year. If you’re curious what that initial set of numbers looks like, I’ve plotted them in Figure 9.2.

Figure 9.2: Mortality rate per year of age
Looking at Figure 9.2, you can say that the probability of dying within one year gets higher as you grow older, which comes as a surprise to no one. If you’re under 65, say, that probability doesn’t even feel that high. It’s less than 0.01 or 1%. The probability that you will die this year only passes 50% after age 100. That’s reassuring, right?
Well, don’t get too optimistic. Your chances of dying every year may be small, but every year is another draw from this morbid lottery. If your chances of dying were 1 out of 2000, then in 2000 universes, you died in one of them. In the other 1999, you live on to another year, but then you have to press your luck again. This happens every year, and the chances slowly get worse.
But what if you wanted to know your chances, at birth, of dying in your 60s, that is between 60-69. For now, we will try to answer this question using only the life table and assuming that we know nothing else about you. The rows of the life table corresponding to this age range are these
| Age | qx | lx | dx | L | Tx | ex |
|---|---|---|---|---|---|---|
| 60-61 | 0.008732 | 88745.98 | 774.97 | 88358.50 | 2051875 | 23.1 |
| 61-62 | 0.009335 | 87971.02 | 821.18 | 87560.42 | 1963516 | 22.3 |
| 62-63 | 0.009983 | 87149.84 | 870.00 | 86714.84 | 1875956 | 21.5 |
| 63-64 | 0.010715 | 86279.84 | 924.46 | 85817.61 | 1789241 | 20.7 |
| 64-65 | 0.011568 | 85355.38 | 987.39 | 84861.68 | 1703423 | 20.0 |
| 65-66 | 0.012586 | 84367.98 | 1061.84 | 83837.06 | 1618562 | 19.2 |
| 66-67 | 0.013763 | 83306.15 | 1146.57 | 82732.86 | 1534724 | 18.4 |
| 67-68 | 0.015057 | 82159.58 | 1237.07 | 81541.05 | 1451992 | 17.7 |
| 68-69 | 0.016380 | 80922.51 | 1325.52 | 80259.75 | 1370451 | 16.9 |
| 69-70 | 0.017756 | 79596.98 | 1413.34 | 78890.31 | 1290191 | 16.2 |
This is a lot of numbers. Recall that each qx is the mortality rate for age x, the probability of dying within one year of age x. So should you add up the qx-values for each age in the interval 60 to 69? Maybe pause here to think about this question for a moment before reading on.
Here is a partial answer. You can die at 62 and you can die at 64, but you can’t die at both ages. In that sense, it was okay to add the probabilities of these events because they are disjoint, i.e., they can’t both happen and you are interested in whether any one of them does happen. However, if you add up these probabilities, you will still over-estimate the probability for a different reason. Can you guess what you’ve left out?
Here is the rest of the answer. You’ve left out the fact that these probabilities assume that you have already made it to 60, and there’s a chance (at birth) that you won’t.
To answer the original question, you want to add up the following probabilities:
(Probability of making it to 60 and then dying at 60) +
(Probability of making it to 61 and then dying at 61) +
... +
(Probability of making it to 69 and then dying at 69) +
How do you figure out the probability of making it to 60 without dying? It sounds a little bit like a riddle whose answer is “one year at a time.” Indeed, to make it to 60 without dying, you need to not die every year for the first 59 years of your life.
Note that, while death can occur in only one year of your life, to survive into your sixties you need ALL of the following to be true: NOT dying at 0 AND NOT dying at 1 AND … NOT dying at 59. The probability of each event (not dying in each year) is independent, and the probability that all of them happen is the product of the individual probabilities.
Probability of NOT dying at 0 *
Probability of NOT dying at 1 having made it to 1 *
... *
Probability of NOT dying at 59 having made it to 59
Since in any given year, you either die or don’t die, these two probabilities must add up to 1, so having gotten to any age x, the probability of surviving it is (1-qx). Now we can take the product of (that is, multiply) all of the survival probabilities (1 - qx) for each x from 0 up to age 59. (I will include the code here. The data table I have loaded from the National Center for Health Statistics is called “lifetableNCHS”).
prod(1-lifetableNCHS[1:60,"qx"])## [1] 0.887458You may notice that this probability had already been calculated for you in the life table, but it had been presented slightly differently as column lx, which is the number of persons (in a cohort of 100,000) surviving to exact age x. If we multiply our rate by 100000, we get 88745.8, which (up to a rounding error) is the same as the number in Table 9.1.
Okay, so now we are ready to complete the probability calculation. Recall we wanted to add up ten things: Probability of making it to 60 and then dying at 60, etc. We know that the probability of making it to age x is the same as the value of column lx in the table divided by 100,000. And the probability of dying is qx. So we need to multiply these two numbers in each row and add them up.
The result is 0.1056. An American child born in 2010 has a 10.5% chance of dying in their 60s (and a 20.7% chance of dying in their 70s).
So, we’ve figured out how to do that. And we’re almost ready to move on, but it is worth noticing something. The product of the value qx and lx in each row of the life table is the value dx, which is the number of deaths at age x (or between x and x+1). So when we multiplied and added before, we were really just adding up the number of deaths (dx) at ages 60-69 and dividing by 100,000.
Now hopefully that makes sense to you that this should give us the answer we were originally looking for, namely what are the chances, at birth, of dying in your 60s. We could have looked at our hypothetical cohort of 100,000 people all born at the same time and asked: how many of them will die in their 60s. Well, that would be the sum of the dx-values, namely 10562. It wouldn’t be a probability, though, unless we divided it by the total number of people (100,000).
So we’ve shown that we can answer our particular question two different ways:
- Computing the total probability of your making it to 60 and then dying at 60 or making it to 61 and dying at 61 or making it to 62 and dying at 62 etc. up to age 69.
or
- Computing the overall proportion, out of 100,000 people, who die in their 60s.
A = B in this case. An important property of mathematical sciences is that you can arrive at the same answer in different ways. Maybe that sounds like a waste of time, but I view it as one of the most reassuring things about math. If you try something two different ways, and you do not get the same answer even though you should, then something is probably wrong with the way you are thinking about it.